Seeing how much you’ve spent and earned on a project without waiting for month-end is how you price correctly and catch losses early. FYPAN’s Analytics screen presents project and supply data under revenue, cost, profit and VAT headings with charts. This guide explains how to read it.

Count, cost, sales and profit are shown on the same chart by project date. You see at a glance how many projects opened in which month and their net profit — so you catch busy but low-margin periods early.
Count, cost, sales and profit are tracked together by order month. Cost increases on the supply side show up here; you can follow how much a material item affects you through the year.
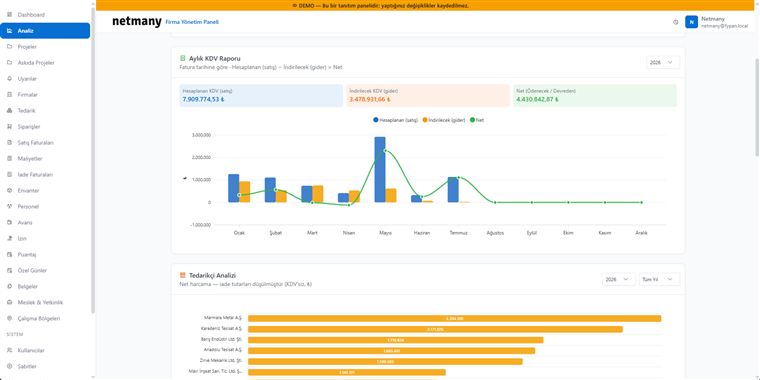
Calculated VAT (sales), deductible VAT (expenses) and the net amount (payable/carried forward) are shown separately by invoice date. You see the net figure in advance while preparing for the declaration period.
If you’d like to see the analytics screen with your own project data, let us set up a custom demo.